Overview
Welcome to HqO Admin—your command center for experience management, tenant engagement, and operational excellence.
The HqO platform empowers you to deliver seamless, high-impact digital experiences across your real estate portfolio. With our integrated suite of tools, you can:
-
Control access to spaces, amenities, and digital credentials
-
Manage buildings at scale from a single unified view
-
Streamline programming, communication, and service workflows
-
Coordinate operational tasks across stakeholders
Key Features
🚀 My HqO: Your Experience Command Center
NEW The My HqO Homepage is your action-oriented hub and springboard for property performance. It gives you real-time visibility and control over your entire portfolio—empowering you to move quickly, optimize engagement, and make data-backed decisions. From portfolio-wide insights to building-specific actions, My HqO connects experience management with measurable outcomes.
Key capabilities include:
-
Portfolio & Building View Toggle: Zoom in on a single property or scan your entire portfolio.
-
Actionable Insights Dashboard: Review 30-day engagement stats, visitor and access activity, events, bookings, comms, surveys, and content performance—at a glance.
-
Quick Create Actions: Launch new initiatives—surveys, content, notifications, and more—directly from your homepage.
🔐 Accessing the Homepage
-
Log in to https://gohqo.co/ and land directly on the My HqO Homepage.
-
All buildings you have access to will populate homepage widgets.
-
Use the building filter to drill down to a specific property.
🏢 Filtering to a Building
To focus on a single building:
-
Select it using the filter in the top right.
-
All data on the page will update automatically.
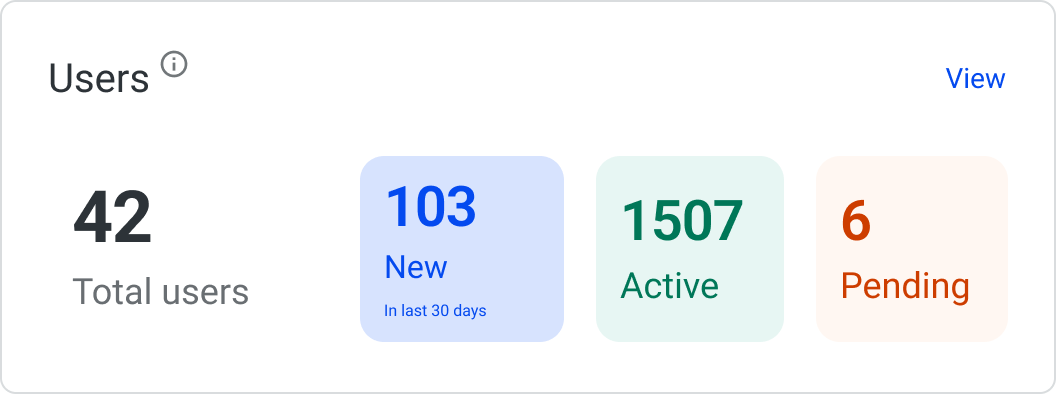
👥 Viewing User Statistics
The Users card provides a snapshot of engagement across your selected property. It includes key metrics to help you monitor user growth and activity:
-
Total users: The total number of users that are active, pending or new.
-
New users (last 30 days): Users who have been invited or activated within the past 30 days.
-
Active users: The total number of users who have activated their account.
-
Pending users: Users who have been invited but have not yet activated their accounts.
Click View to access the Users Page for deeper user management.
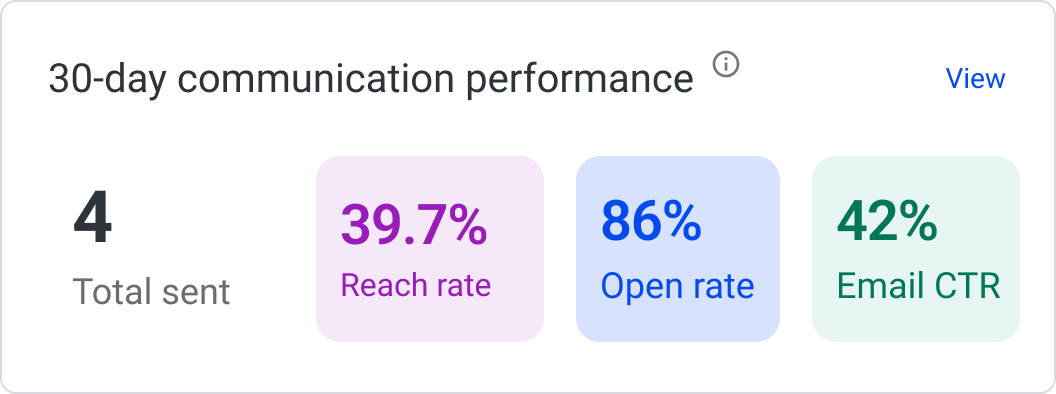
📢 Analyzing Communication Performance
Use the Communication Performance card to assess the impact of your outreach efforts, visualized as a performance funnel—from messages sent to user interaction.
Key metrics include:
-
Total sent notifications: The number of notifications distributed over the past 30 days.
-
Reach rate: The percentage of opted-in users who successfully received a notification.
-
Open rate: The percentage of recipients who opened a notification.
-
Email click-through rate: The percentage of users who clicked a link within an email notification.
Click View to access the full Communication Dashboard.
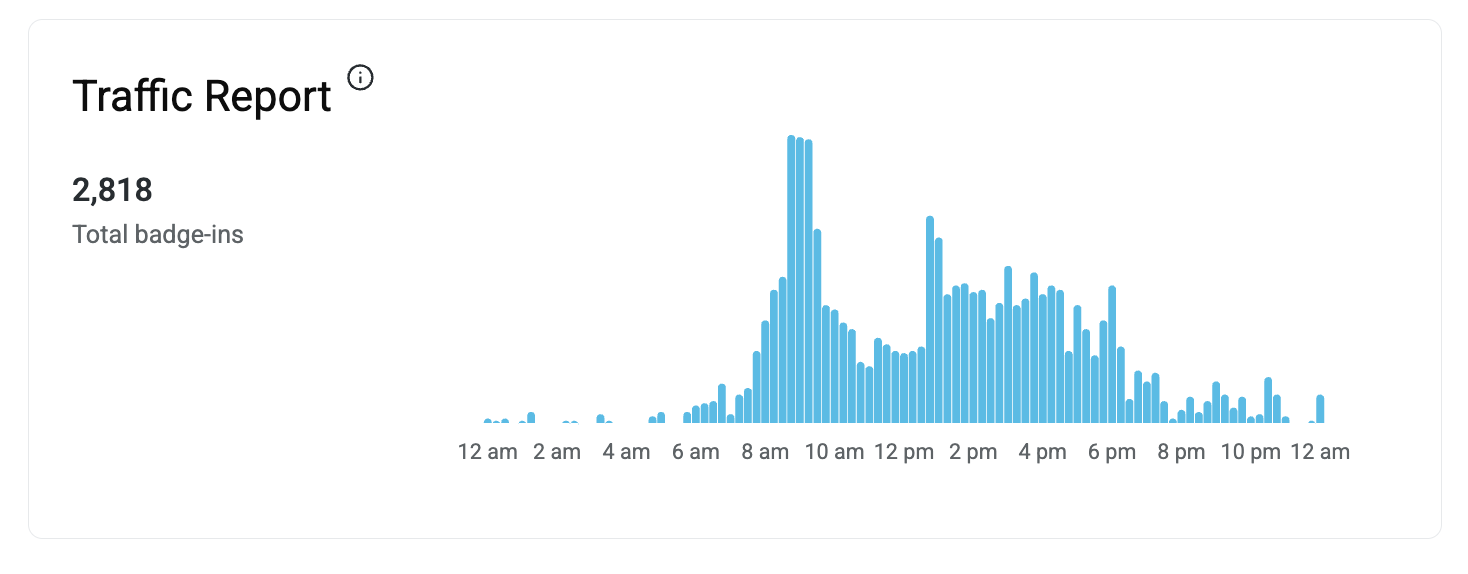
🚦 Reviewing Today’s Traffic Report
If Access Control or Visitor Management is enabled, the Traffic Report card will display:
-
Total badge-ins for the day
-
Entry trends in 15-minute intervals
Click View Activity to explore access details in the Access Control Command Center.
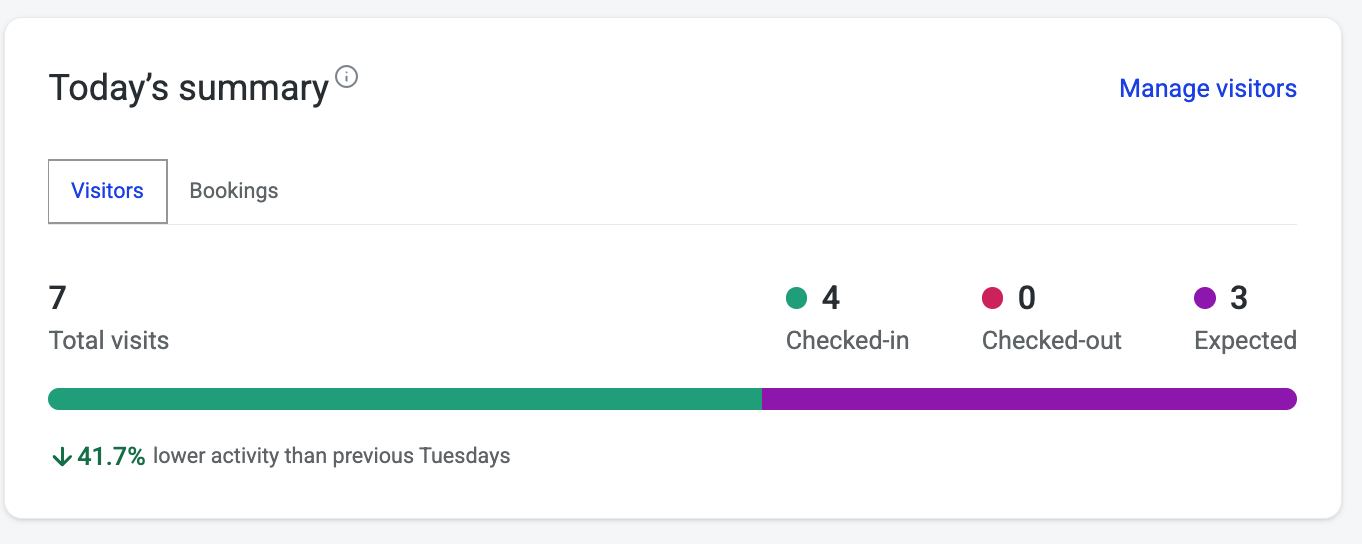
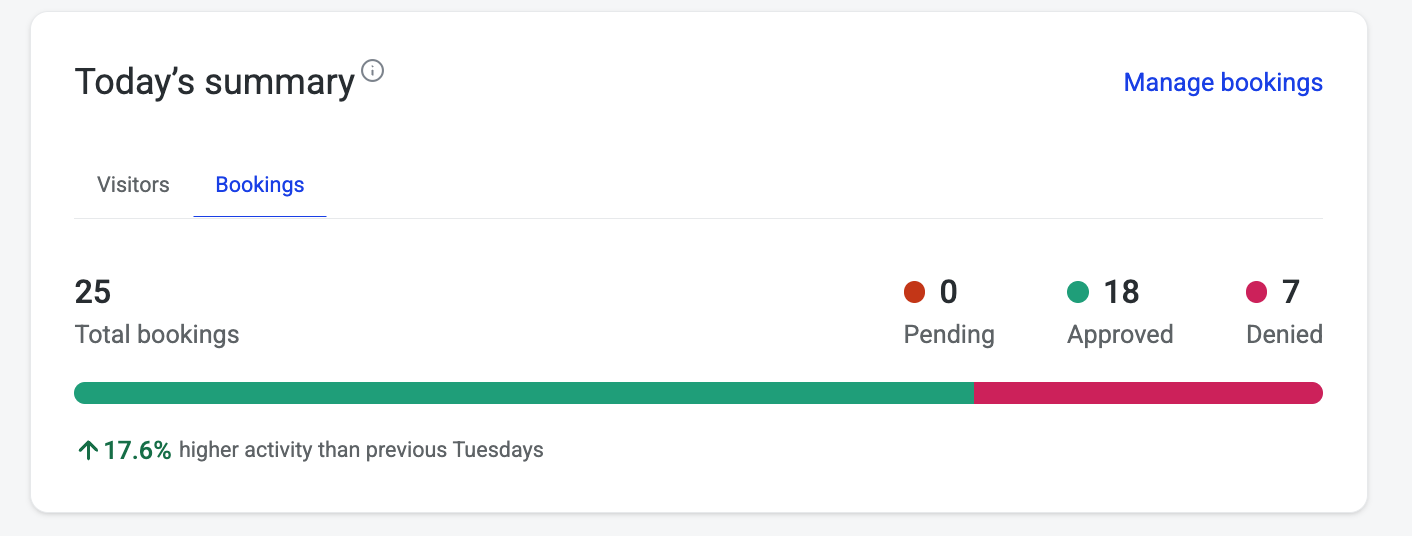
📆 Today’s Summary
Stay informed about visitor and booking activity:
-
See visit summaries and statuses
-
Booking summaries (approved, pending, denied)
-
Daily trend comparison to the previous month
🎉 Events
See what’s coming up:
-
View event cards with registration and details
-
Click View All to open the Events Page
.png?cb=0feaa71ba77d72efecacfcd55597159b)
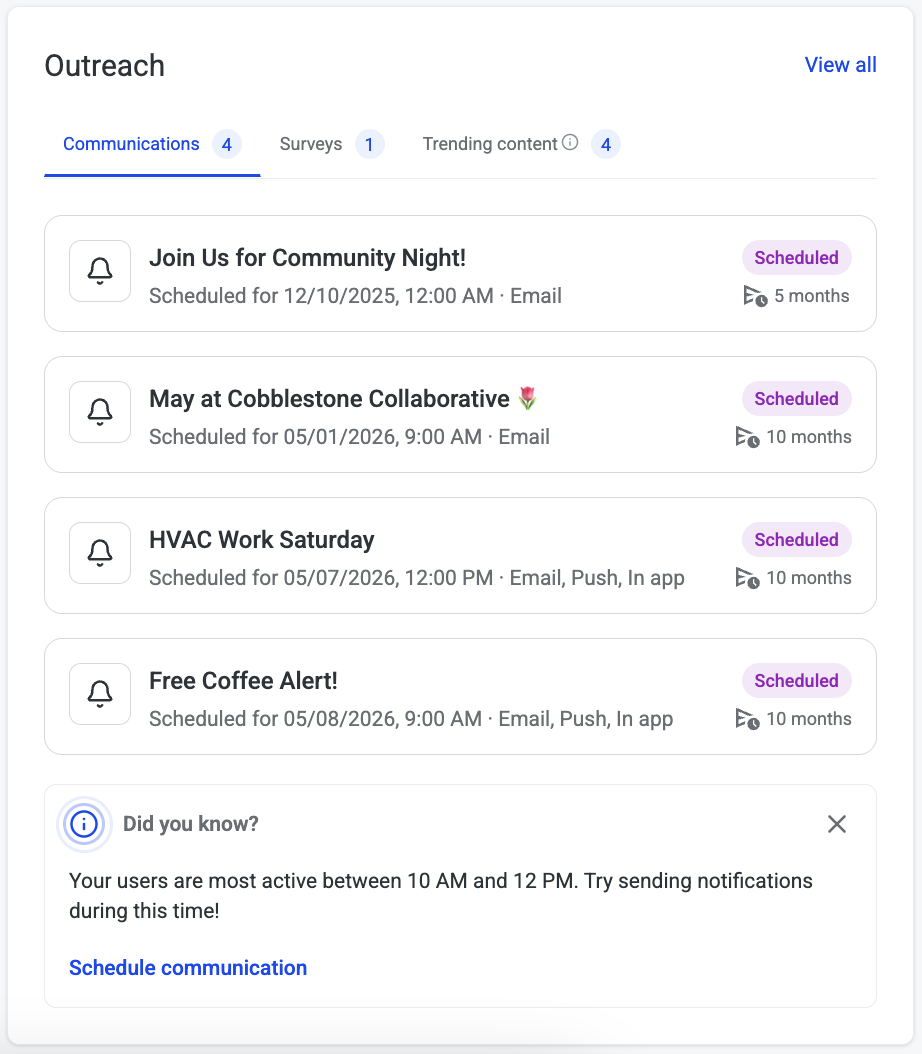
✉️ Outreach Section
Monitor ongoing campaigns:
-
Live communications and surveys
-
Days live and submission counts
-
Top-performing content and ideal send times
Activity Stream NEW
The Activity Stream gives admin users a live, real-time feed of what’s happening across their portfolio or at a specific building—making it easier than ever to stay informed and take action.
This dynamic feed consolidates updates from across key modules including Access, Bookings, Surveys, RSVPs, and Visitor Management. Whether a visitor is registered, a survey is completed, or a resource is booked, you’ll see it all populate in a clear, chronological view.
🔎 How to Use the Activity Stream
-
Select your building filter
-
On the top right of the My HqO homepage, use the building filter to choose whether you want to see activity across your entire portfolio or for a single building.
-
-
Scroll to the bottom of the page
-
The Activity Stream is located at the bottom of the My HqO homepage.
-
-
Navigate activity types
-
Use the tabs at the top of the Activity Stream to view updates by type: Access, Bookings, Surveys, RSVPs, Visitors, or All.
-
-
Filter by tenant
-
Within the Activity Stream, use the tenant filter to drill into activity for a specific tenant.
-
-
Take action quickly
-
Each update includes contextual links (e.g., “View responses,” “View visitors,” “View bookings”) so you can follow up without leaving the page.
-
✅ Key Capabilities
-
Filter by building on the homepage, then by tenant or activity type within the Activity Stream
-
See updates as they happen: registrations, bookings, survey responses, and more
-
Take immediate action with direct links to related pages
-
Track engagement and operations in one consolidated feed
.png?cb=239587c55f6a3cb3e29b2c01451fb636)
💡 Tips for Efficiency
-
Use filters to narrow your focus to key buildings or user groups
-
Track engagement patterns via the Communication Dashboard
-
Plan events and campaigns ahead with real-time performance data
-
If a widget doesn’t yet have data, you’ll see helpful prompts that guide you toward next steps—whether it’s launching a new communication campaign, creating an event, or activating access features.
🏢 Building List
Access and manage all buildings in your portfolio in one centralized view.
-
Faster Access: Find building data instantly.
-
Quick Edits: Update info without switching tabs or losing context.
-
Data Accuracy: Built-in validations help maintain data quality.
Features:
-
Full list of buildings with population editing directly in-table
-
Navigate to individual Building Overview pages
-
Square feet/meters toggle for size entries
-
Status controls to manage live, draft, or upcoming buildings
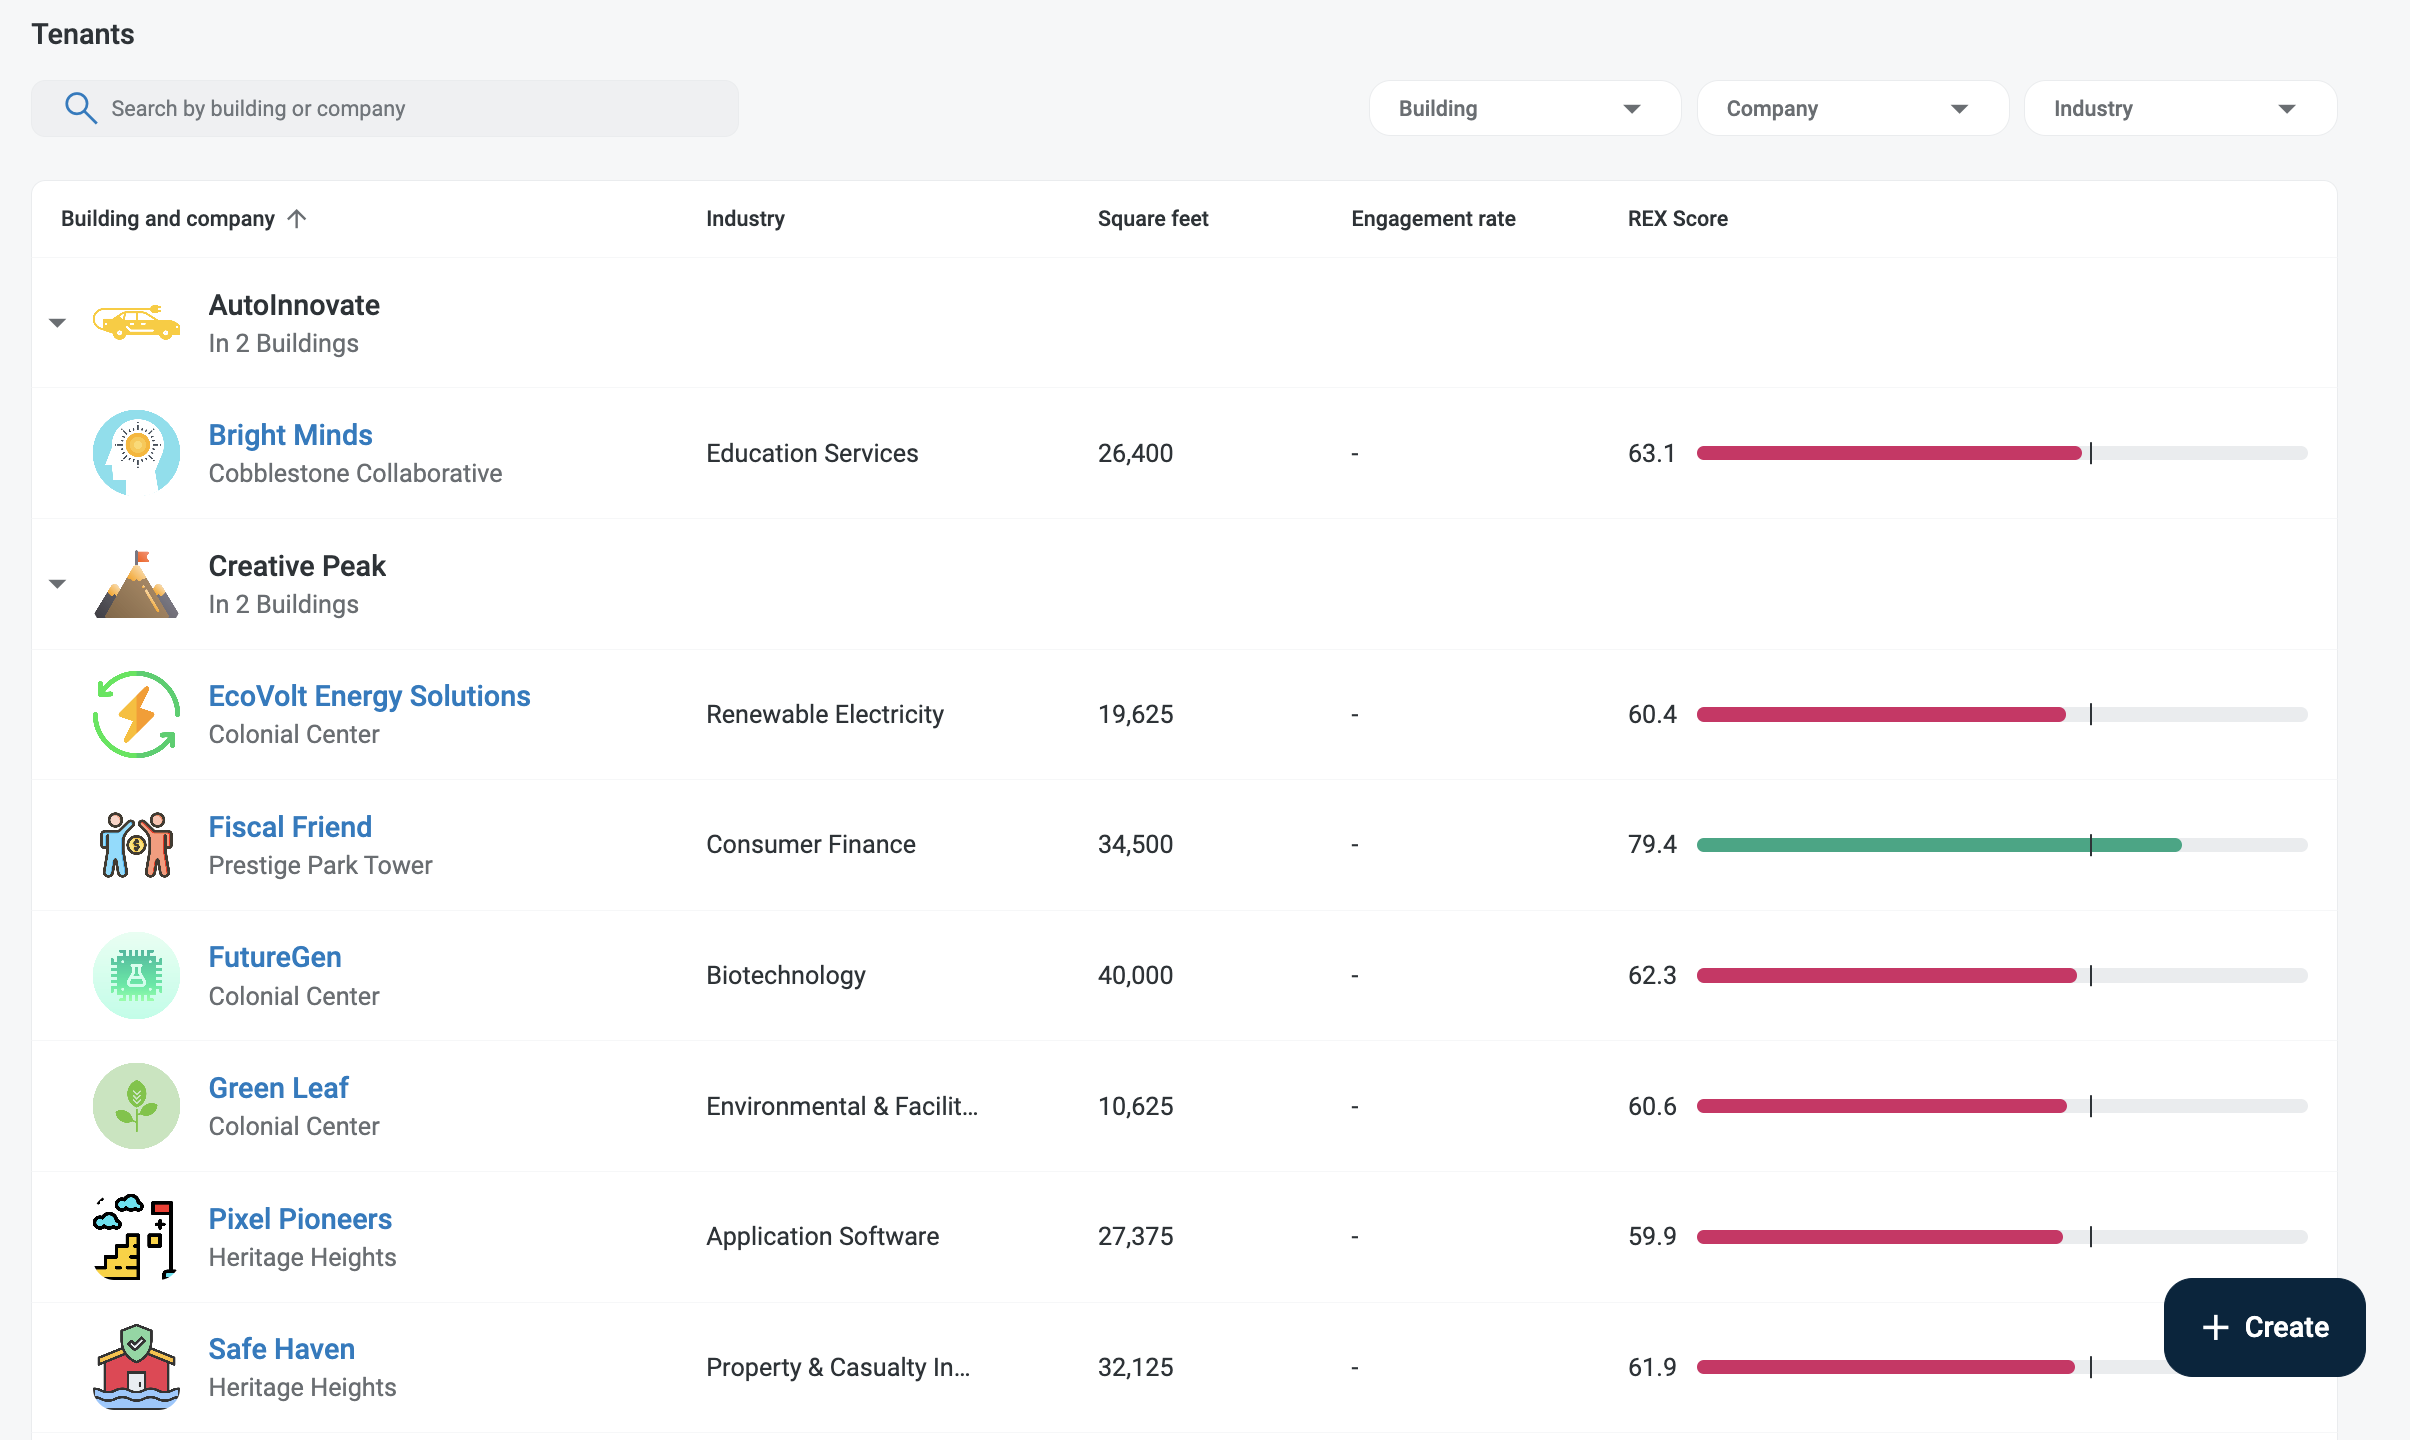
🧑💼 Tenant Company List
Understand your tenant base and proactively manage relationships.
-
See a consolidated list of tenant companies by building
-
Filter by company, industry, or location
-
View company profiles including square footage, engagement rates, and REX Score
-
Identify high-risk tenants and drive retention with insights
More info: Tenant Company List Guide
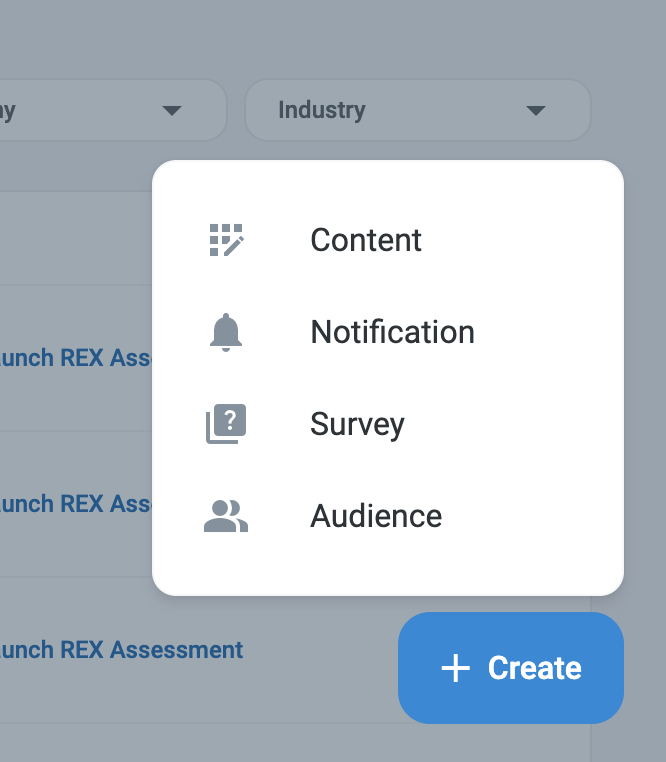
⚡ Quick Create Actions
Speed up day-to-day tasks with Create Shortcuts located at the bottom-right of the homepage.
Depending on your role, you can quickly launch:
-
Content (Programmer)
-
Notifications (Notifier)
-
Surveys (Programmer)
-
Audiences (Programmer, Operator, Manager)