Intelligence
A New Source of Truth for CRE
Commercial real estate leaders know this: the health of a property isn’t just measured in leases signed. It’s measured in the everyday signals of tenant activity, satisfaction, and engagement. Until now, those signals have been fragmented across tools and systems.
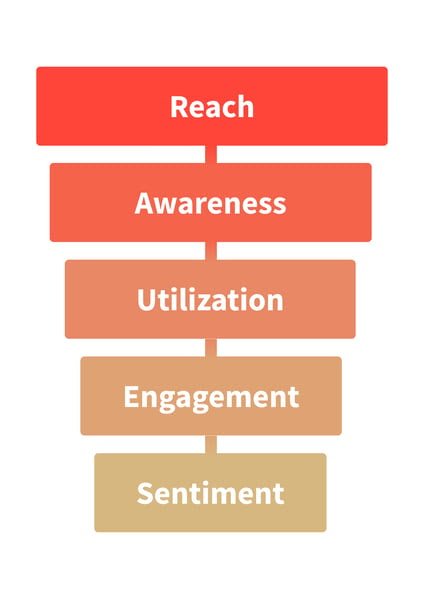
With HqO’s Intelligence Dashboard, you now have a single source of truth for understanding your building’s full performance — from Reach to Sentiment. This new framework gives you a clear funnel to follow, helping you diagnose strengths, spot risks, and connect strategy directly to tenant expectations.
Here’s how it works.
Reach
How many can you impact?
Start with the basics: Reach is the total number of people connected to your building through HqO REX Platform. Not just app registrants — but anyone you’ve added to your contact base.
This gives you the full scope of your influence: the audience you could be engaging. With a single view of total contactable users via email, app, and web, teams can track growth trends and ensure their messaging has maximum impact.
Key capabilities:
-
Unified Contact View: Consolidates email, app, and web contacts into one total count
-
Trend Monitoring: Visualizes growth in reach over time to assess portfolio communication performance
-
Channel Visibility: Breaks down availability across all supported communication channels
-
Portfolio-Wide Metrics: Aggregates reach data across all buildings and tenants
-
Performance Insights: Highlights percentage change from previous periods to monitor growth momentum
Awareness
Are they paying attention?
The next step is Awareness — tracking how many people are engaging with your emails, push notifications, and content.
The Awareness dashboard helps teams pinpoint communication performance and optimize message timing and channels. Think of this as the pulse check: are tenants opening, reading, and responding to your outreach? If not, the funnel breaks here.
Key capabilities:
-
Communication Engagement Rate: Measures the percentage of tenants engaging with outreach
-
Multi-Channel Breakdown: Tracks engagement across email, push notifications, and in-app content
-
Trend Visualization: Monitors changes in awareness levels over time
-
Performance Delta: Flags increases or decreases compared to the previous period
Utilization
Who's actually using the space?
Awareness is good, but Utilization shows reality: how many people are swiping into the building or checking in as visitors.
It answers a fundamental question: are people showing up and using the space?
Key capabilities:
-
Access Swipe Tracking: Captures building entry data from access control systems
-
Visitor Check-In Monitoring: Logs guest activity and front desk interactions
-
Total Building Interactions: Aggregates all forms of physical access into a single metric
-
Utilization Trendline: Tracks space usage fluctuations over time to identify drop-offs or spikes
-
Portfolio-Level Comparison: View utilization data across all properties to detect underperforming assets
Engagement
Are they using your services?
Engagement goes deeper: measuring how tenants interact with your building’s ecosystem. From booking rooms and attending events to submitting work orders and using amenities, this is where you see true tenant behavior.
Admins can even add usage from offline workflows or external systems — making this the most comprehensive measure of building engagement available.
Key capabilities:
-
Building Engagement Tracking: Captures tenant actions across bookings, RSVPs, work orders, registrations, feedback, and more
-
Resource Booking Analytics: Identifies top spaces and time-of-day trends (e.g., most popular day: Wednesday)
-
Event & Amenity Metrics: Tracks popularity of events, amenities, and order-ahead services
-
Tenant-Level Engagement: Highlights most active tenants by RSVP count and participation
-
Behavior Trends: Visualizes engagement fluctuations over time for proactive strategy planning
Sentiment
Do they value the experience?
Finally, Sentiment turns participation into perception. Through surveys, NPS, star ratings, and Leesman benchmarks, you capture how tenants feel about their experiences.
This is the top of the intelligence funnel: knowing not just what people are doing, but how they perceive the value you deliver.
Key capabilities:
-
Survey Distribution & Response Tracking: Measure tenant satisfaction and feedback in real time
-
Tenant Participation Rate: Monitor engagement with experience surveys at the individual or portfolio level
-
Sentiment Trendline: Visualizes shifts in tenant mood and satisfaction over time
-
NPS Deployment: Launch Net Promoter Score campaigns directly from the dashboard
-
Integrated Benchmarking: Leverage Leesman data to compare sentiment across buildings, portfolios, and global standards
Bonus Insight
Think funnel-first
Don’t just look at engagement in isolation. Ask: How many people can I reach? How many are aware? How many are utilizing the property? How many are engaged? And finally, how do they feel?
Use Portfolio Comparison to apply this funnel across multiple assets. If one building excels at Awareness but lags in Utilization, learn from the leaders and replicate success.
HqO Feature Highlight
Learn what your ideal tenant profile values most
In today’s data-driven real estate market, knowing what tenants truly want is the key to success. The Occupier Insights, powered by Leesman, transforms survey data into clear insights about your Ideal Tenant Profile (ITP).
With REX, you’ll see what workplace factors matter most, where satisfaction is highest (or lowest), and how to align your amenities, programming, and communications for maximum impact. The result? Smarter investments, stronger engagement, and better ROI across your assets.
Key capabilities:
-
Benchmarking & Analytics: Compare tenant sentiment against global benchmarks from over 1.4 million respondent insights from 9,500+ workplaces and 1,800+ surveys
-
Ideal Tenant Profile (ITP) Insights: Identify the most important workplace activities and features that matter most to your ideal tenants
-
Actionable Data for CRE Strategy: Connects workspace variety to tenant outcomes like pride, productivity, and enjoyment—helping teams reduce capital spend and boost retention