Measure the impact of your communications—both email and push notifications—directly from the Communications module. This feature provides insights into delivery, engagement, and performance metrics, helping property teams refine messaging strategies and maximize tenant engagement.
📊 Email & Push Notification Analytics
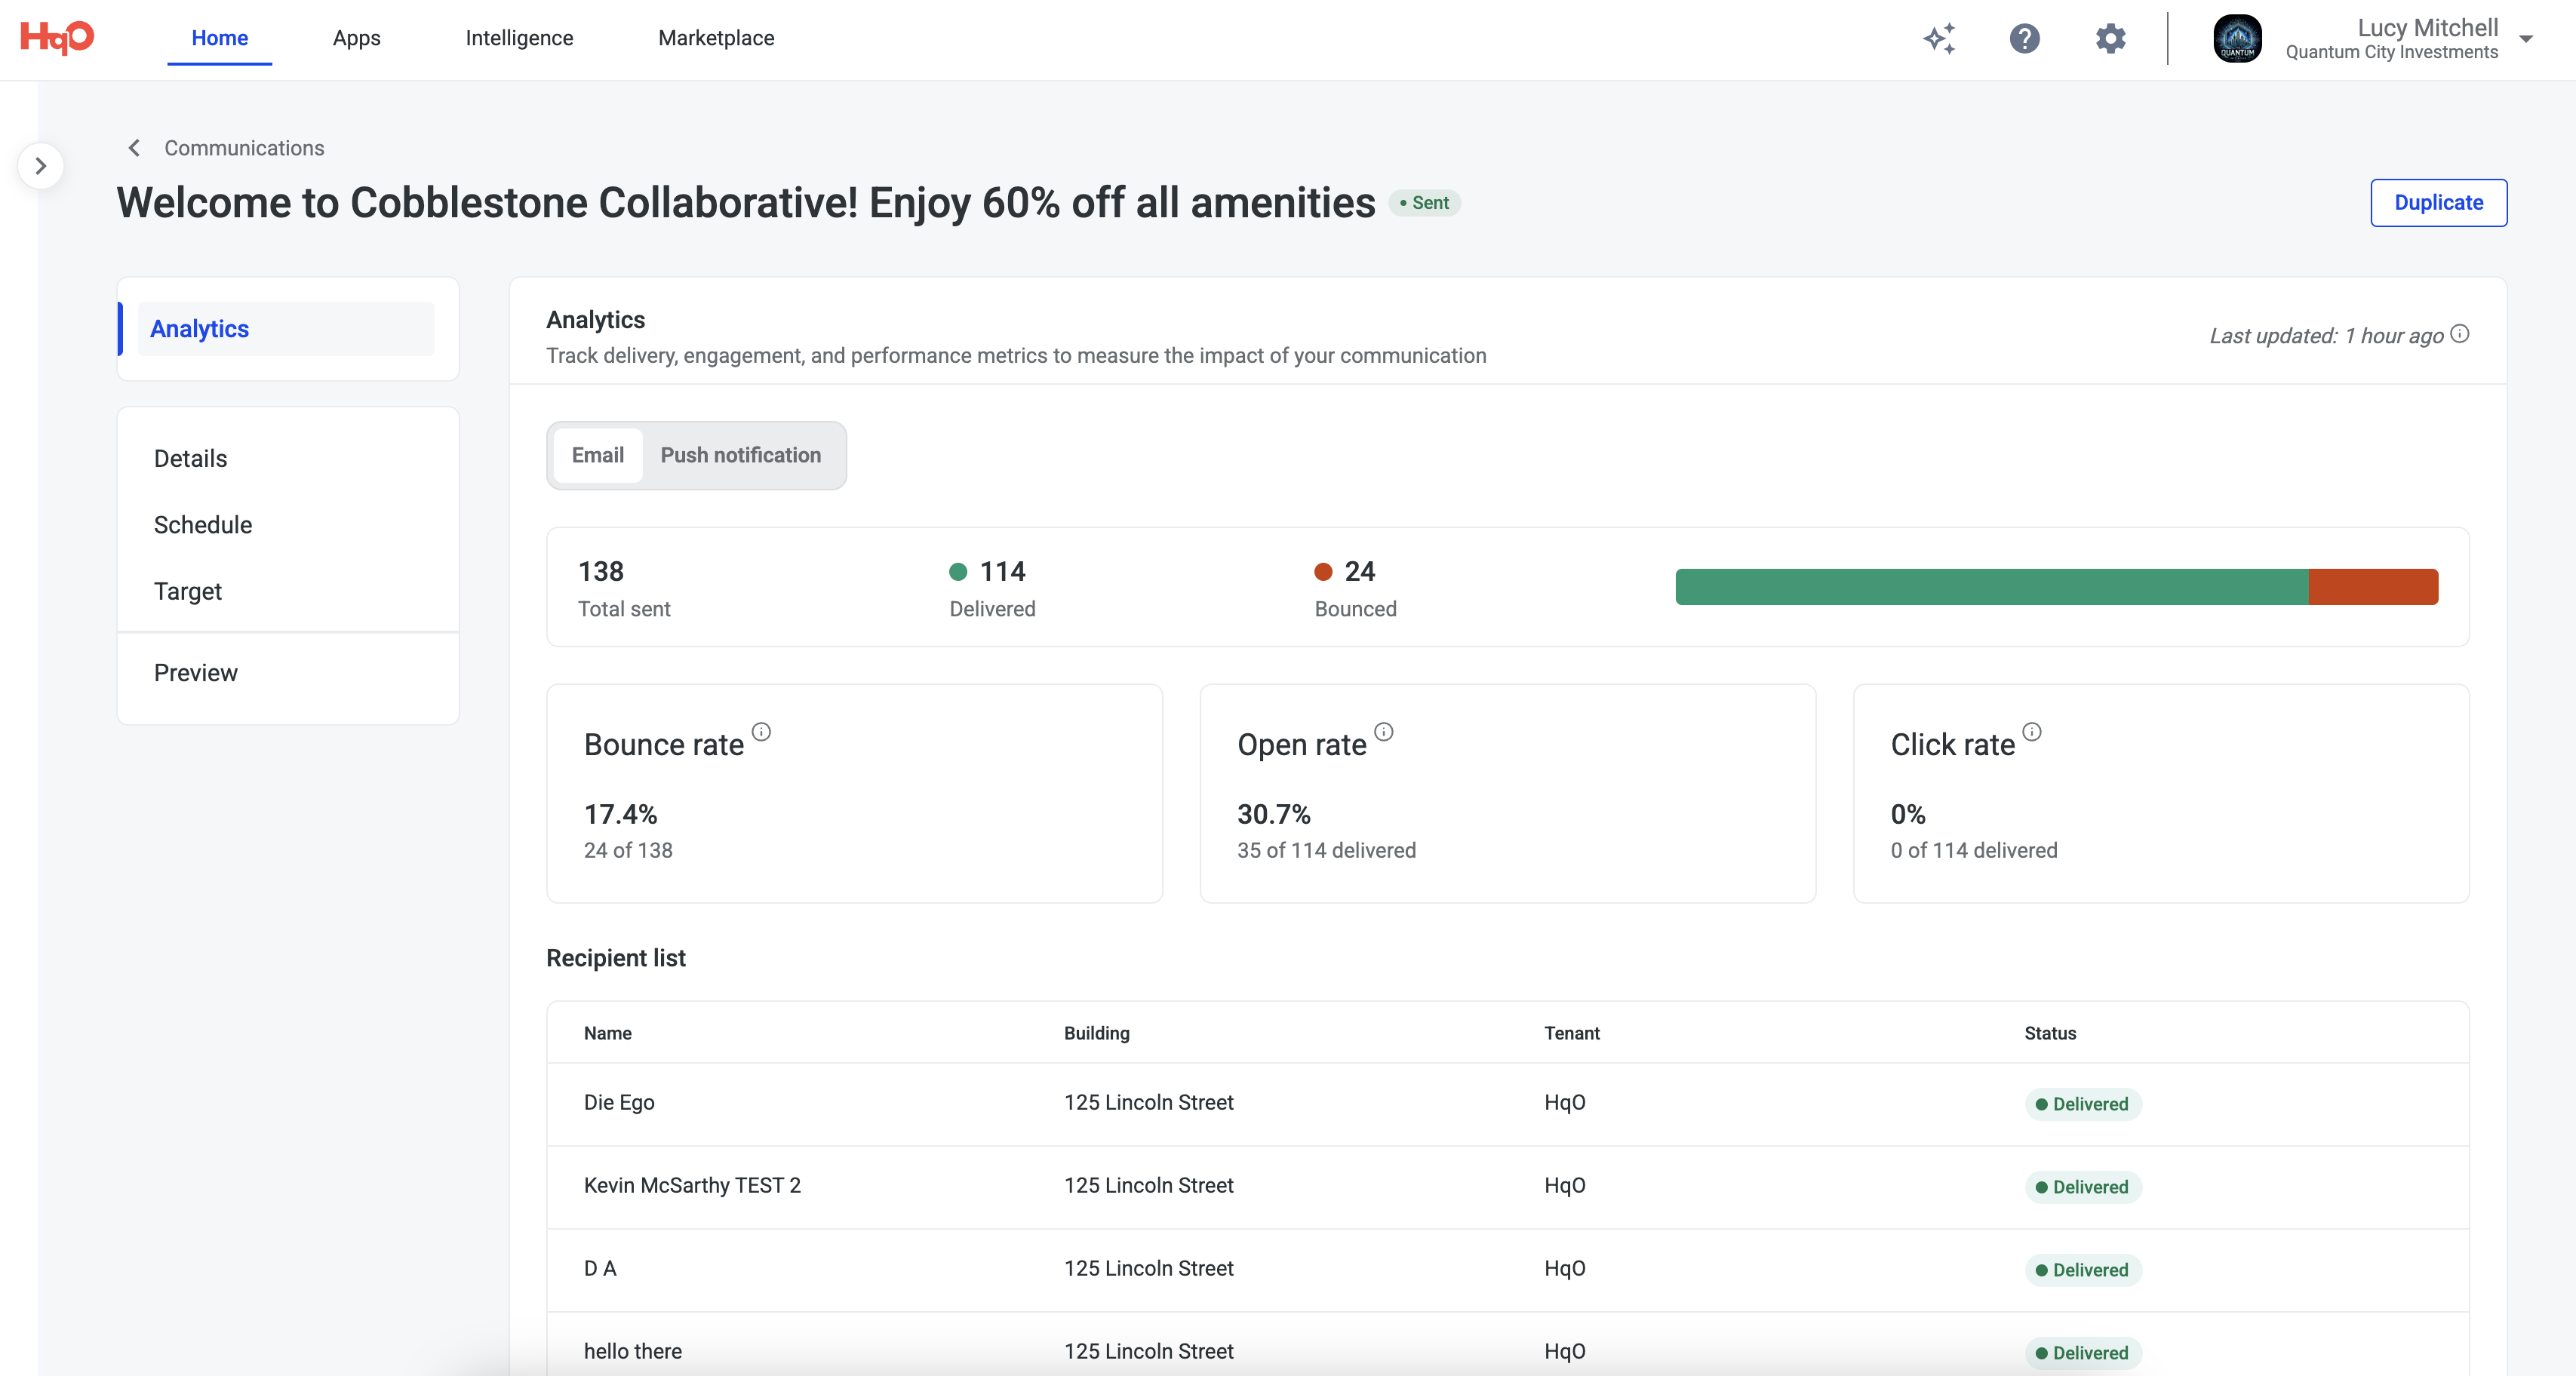
Navigate to the Analytics tab within a specific communication to view metrics tailored to each delivery channel. Switch between Email and Push notification using the tabs at the top of the analytics module to see performance for dual campaigns.
Metrics Available:
1. Total Sent
-
The total number of messages sent to the audience across the selected channel.
2. Delivered
-
Number of successfully delivered messages.
-
This excludes any that bounced due to invalid addresses or delivery errors.
3. Bounced
-
Count and percentage of undeliverable emails or push notifications.
-
Bounce rate is calculated as: Bounced ÷ Total Sent
4. Open Rate
-
Number and percentage of recipients who opened the email or push notification.
-
Calculated as: Opens ÷ Delivered
5. Click Rate (Email only)
-
Percentage of recipients who clicked on at least one link within the message.
-
Calculated as: Clicks ÷ Delivered
👥 Recipient List
Scroll down within the Analytics tab to view the Recipient list, which includes:
-
Name of the recipient
-
Building associated with the user
-
Tenant company
-
Delivery status: Delivered or Bounced
This helps you diagnose issues such as high bounce rates and verify message delivery across buildings and tenant organizations.
📈 Improve your Campaigns
-
Gauge the effectiveness of subject lines and content via open and click rates.
-
Confirm that key messages were delivered to all target buildings and users.
-
Identify trends in tenant engagement across campaigns.
-
Duplicate successful camaigns using the duplicate CTA in the top right.
🕒 Data Refresh
Analytics are updated hourly. You can see the Last updated timestamp at the top right of the Analytics panel to confirm when metrics were last synced.