The new Portfolio Analytics dashboards in Intelligence feature many of the same analytics that we had on the Admin Analytics dashboards, reframed to focus on tenant experience and business outcomes. This document should serve to guide our customer-facing teams in explaining the new charts, with comparisons to the old platform.
Overview
Much like Admin Analytics, Portfolio Analytics is scoped by landlord. People have the ability to filter by Building, Tenant, Timeframe, and View by (for line charts on the Overview page).
Admin Analytics automatically filtered dashboards to show data from the past 30 days. Portfolio Analytics instead defaults to show data from the past 12 complete weeks.
KPI Cards
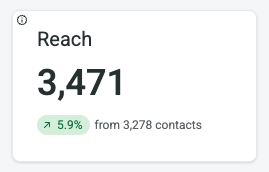
Reach
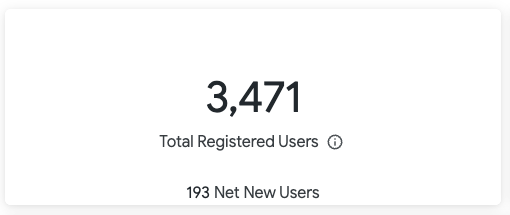
Reach refers to the contacts added by a customer. This includes tenants, property managers, vendors, or other people who may interact with a given building in HqO. The equivalent of this in Admin Analytics was Total Registered Users.
Awareness
Awareness is a newer metric introduced in Portfolio Analytics. People are considered Aware if they engage with Content, Amenity Posts, Communications, or Utility Buttons.
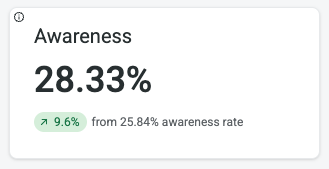
In the example to the left, of the 646 Reached contacts, 183 of them are Aware, giving the building an awareness score of 28.33%.
Utilization
Utilization is a newer metric introduced in Portfolio Analytics tracking on-site building interactions. This is measured through a total count of access scans and visitor check-ins in the filtered period.
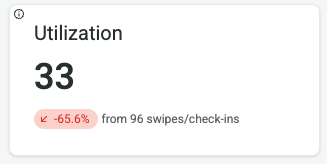
Mobile Access Utility Button clicks are not included in the Utilization metric. This is measured under Awareness.
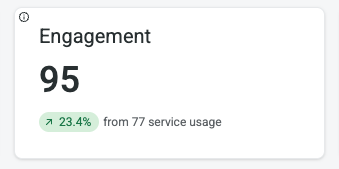
Engagement
Engagement is a newer metric introduced in Portfolio Analytics. Engagement is measured by counting the following user actions:
-
Booking a service, event, or resource
-
Submitting a work order request
-
Ordering food or a beverage
-
Responding to a survey
-
Registering a visitor
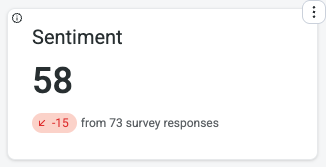
Sentiment
Sentiment is a newer metric introduced in Portfolio Analytics. This is a count of submitted survey responses across the filtered timeframe.
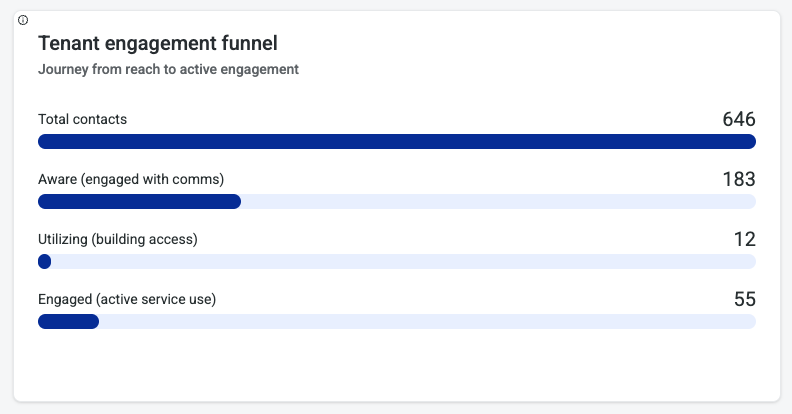
Tenant Engagement Funnel
The tenant engagement funnel shows the journey from reach to engagement. This is all measured through counts of contacts as opposed to counts of actions:
-
Total contacts is equal to the Reach metric defined above.
-
Aware (engaged with comms) shows the count of Aware contacts. This number is divided by Total contacts/Reach to get the Awareness KPI as defined above.
-
Utilizing (building access) is the count of unique contacts whose actions are measured under the Utilization metric defined above.
-
Engaged (active service use) is the count of unique contacts whose actions are measured under the Engagement metric defined above.
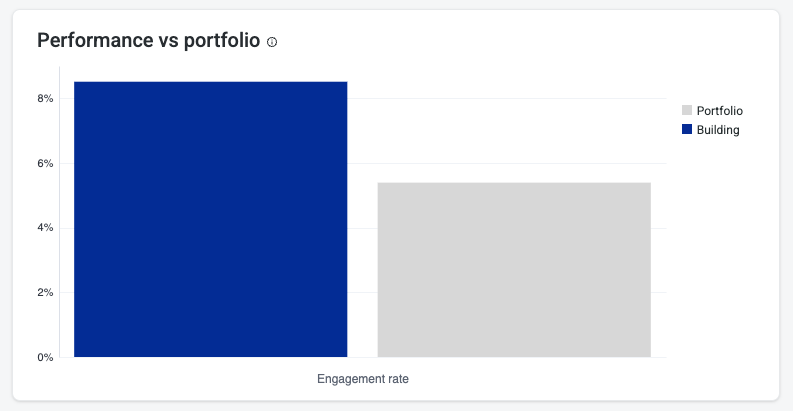
Performance vs portfolio
The Performance vs portfolio chart gives a view of the customer’s overall portfolio engagement vs. the filtered building. The engagement rate is the Engaged (active service use) count from the Tenant engagement funnel divided by the Reach metric defined above.
Reach
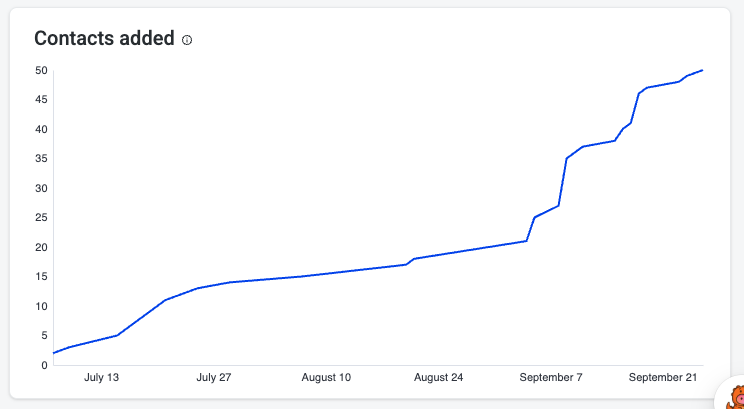
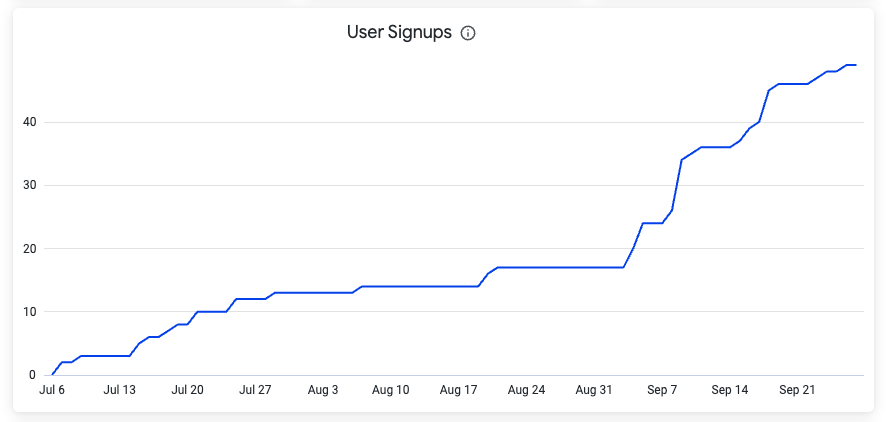
Contacts added
The Contacts added tile in Portfolio Analytics is the equivalent of the User Signups chart in Admin Analytics. This is the count of new registrations over the filtered timeframe.
Engagement
The Engagement tab in Portfolio Analytics combines metrics seen in the Overview, Order Ahead, and Spaces Admin Analytics dashboards, as well as many new visualizations.
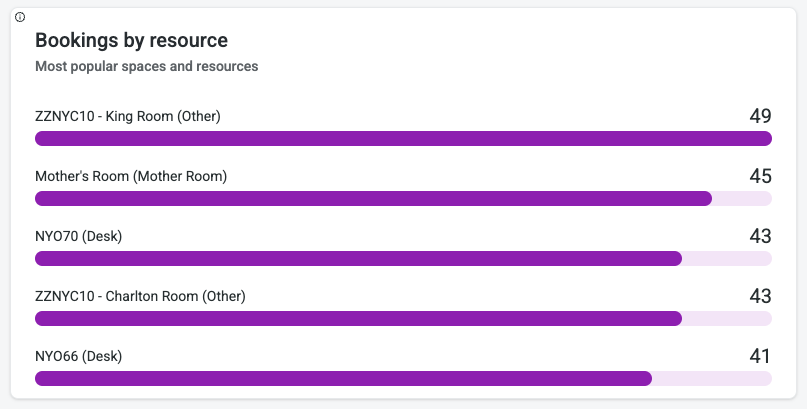
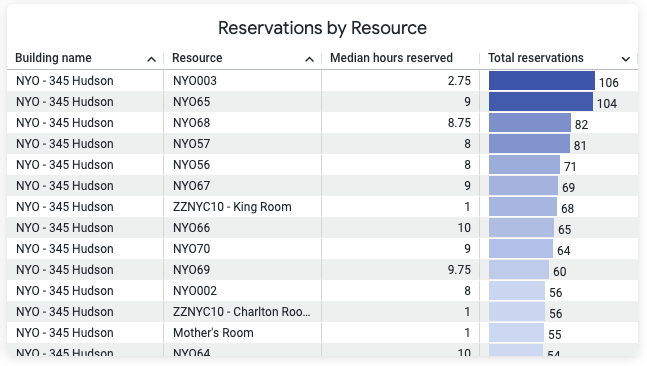
Bookings by resource
Bookings by resource in Portfolio Analytics is the equivalent of Reservations by Resource in Admin Analytics with a few changes:
-
Admin Analytics included all reservations regardless of status, but Portfolio Analytics filters out Cancelled and Denied bookings
-
Admin Analytics only included resources from the native adapter and a few third-party adapters, but Portfolio Analytics includes all resources
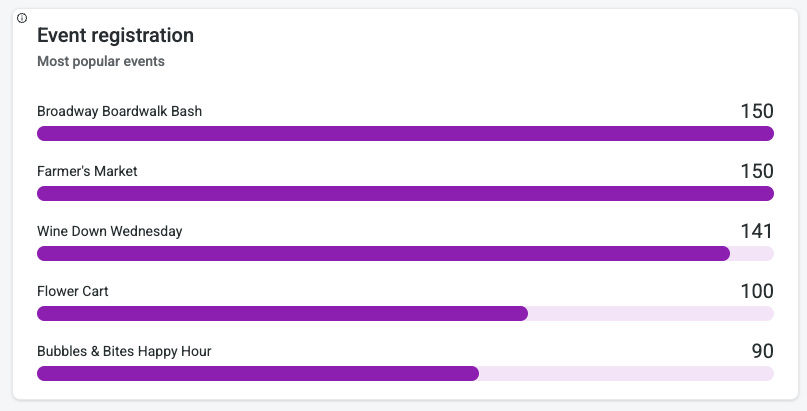
Event registration
We are finally including Events from the new Event Booking flow in Admin! The new Event registration tile in Portfolio Analytics shows event registrations by event title.
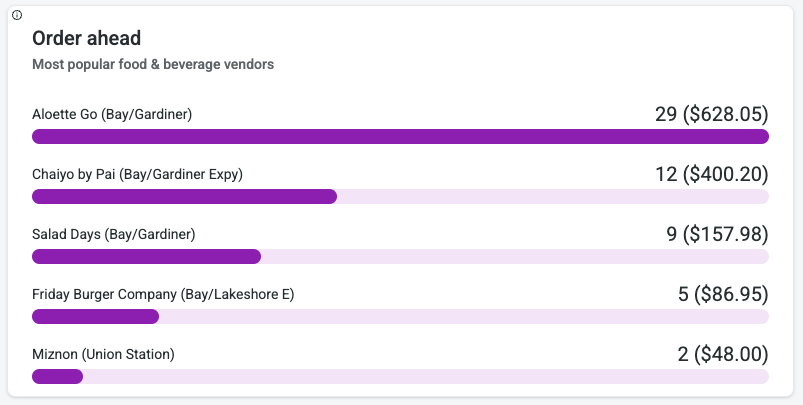
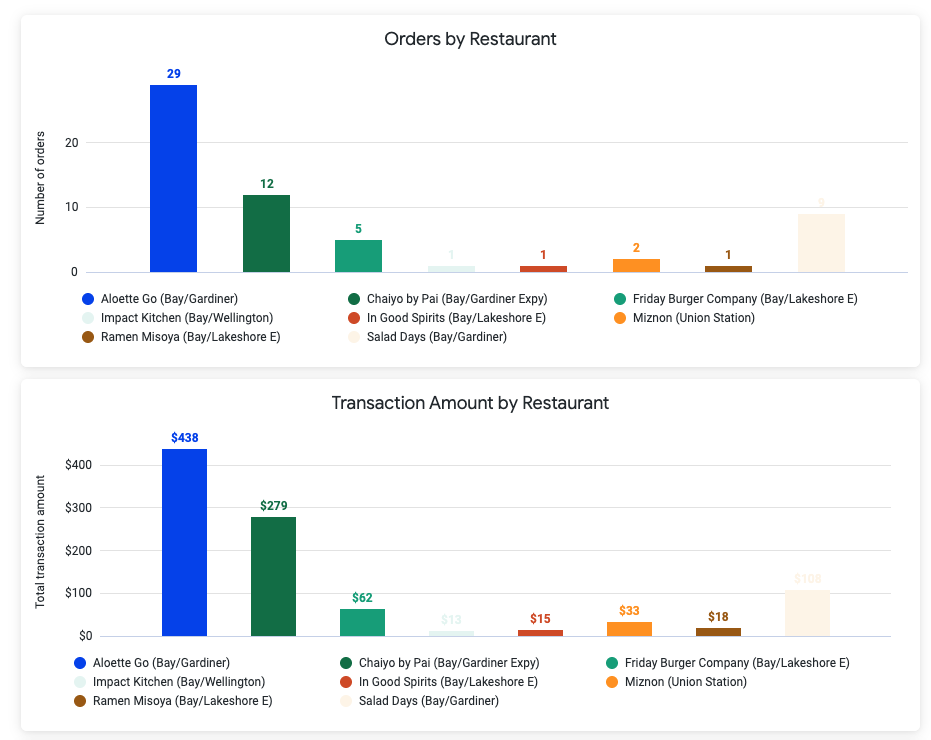
Order ahead
Orders by Restaurant and Transaction Amount by Restaurant have been consolidated into a singular Order ahead tile sorted by total orders within the filtered timeframe.
Related Articles